The old rule in property is there is no one market. We talk about the national average on the evening news, but really, that data point is pretty useless to investors.
CoreLogic recently did some work looking at the SA4 statistical level. This is used by the ABS to group suburbs into broader data points. So it’s not quite as detailed as the suburb level data, but it does help us get a feel for broader geographic trends.
Let’s take a look at the findings for the capitals. But if you’re in Hobart, Darwin or Canberra, sorry, you don’t have any SA4 data. You are a SA4 area yourself.
You can see here that the Sydney market is generally slowing (after some pretty tub-thumping years!)
Don’t get too caught up on the monthly data. That tends to jump around a bit. The quarterly data probably gives the best feel for current trends. On that, the south west, outer west and Blue Mountains are holding ground, but the inner west is past its peak, down 4% over the year, with most of that in the past three months. Ryde and Baulkham Hills and Hawkesbury have also fallen sharply in recent months.

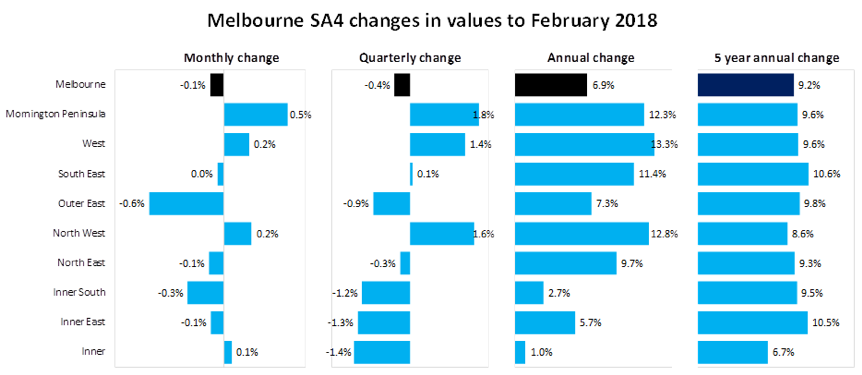
Melbourne is more of a mixed bag, with a more solid city result hiding falls in some areas. Right now, the more expensive inner suburbs seems to be losing traction, while the west, north west and the Mornington Peninsula are still going strong.
Brisbane
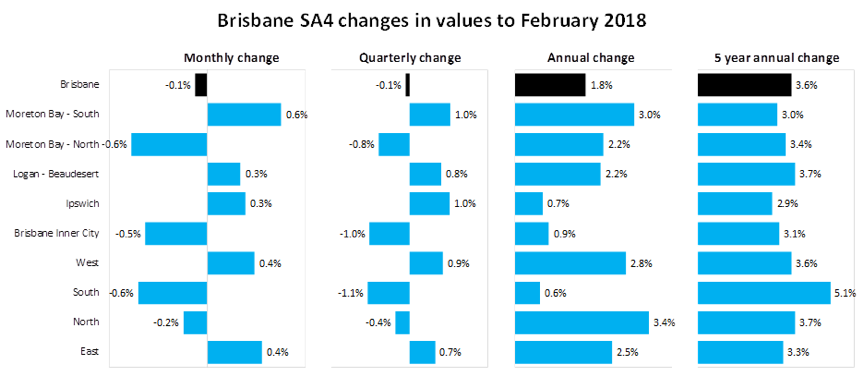
Growth in Brisbane is also patchy, but make no mistake, there are still areas that are doing well!
Probably the annual growth data here gives you the best feel for what’s going on. On that measure, Brisbane’s south, Ipswich and the inner-city have barely kept their heads above water. This doesn’t have much to do with whether a location is affordable or expensive, and is probably driven by local factors, particularly new construction.
There’s fewer SA4 areas in Adelaide, but none of them are particularly dazzling right now. Over the past three months, Adelaide has grown just 0.1%, with most regions around that mark.
Momentum seems to be slowing in Adelaide’s west and in the central and hills districts.

Unlike the other capitals, prices have been falling Perth for a number of years, and that’s reflected in most areas. Note though that inner Perth prices are down just 0.1% over the year, and it might appear that prices there have found a floor. That should be an encouraging sign for the broader Perth market. Prices in Mandurah are also up 1.5% over the quarter.
That said, the north west is still posting heavy quarterly loses, and the annual falls in the south east are grim.

How does your region rate?
Again, there’s still specific markets within these regions, and we don’t buy markets, we buy properties.
Still, some interesting data here if you’re playing the trends.